A) performing an experiment in an economic system.
B) applying mathematical methods to economic analysis.
C) analyzing available data.
D) formulating theories about economic events.
F) A) and C)
Correct Answer

verified
Correct Answer
verified
Multiple Choice
Which of the following is not an assumption of the productions possibilities frontier?
A) A country produces only two goods or types of goods.
B) Technology does not change.
C) The amount of available resources does not change.
D) There is a fixed quantity of money.
F) None of the above
Correct Answer

verified
Correct Answer
verified
True/False
The slope of a line is equal to the change in the x-variable divided by the change in the y-variable.
B) False
Correct Answer

verified
Correct Answer
verified
True/False
For economists, conducting experiments is often difficult and sometimes impossible.
B) False
Correct Answer

verified
Correct Answer
verified
Multiple Choice
Economists use some familiar terms in specialized ways
A) to make the subject sound more complex than it is.
B) because every respectable field of study has its own language.
C) to provide a new and useful way of thinking about the world.
D) because it was too difficult to come up with new terms.
F) A) and C)
Correct Answer

verified
Correct Answer
verified
Multiple Choice
Figure 2-11 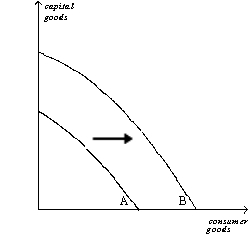 -Refer to Figure 2-11. The shift of the production possibilities frontier from A to B can best be described as
A) a downturn in the economy.
B) economic growth.
C) an enhancement of equality.
D) an improvement in the allocation of resources.
F) B) and C)
Correct Answer

verified
Correct Answer
verified
Multiple Choice
In the circular-flow diagram, in the markets for
A) goods and services, households and firms are both sellers.
B) goods and services, households are sellers and firms are buyers.
C) the factors of production, households are sellers and firms are buyers.
D) the factors of production, households and firms are both buyers.
F) A) and B)
Correct Answer

verified
Correct Answer
verified
Multiple Choice
Which of the following is an example of a normative, as opposed to positive, statement?
A) Gasoline prices ought to be lower than they are now.
B) The federal government should raise taxes on wealthy people.
C) The social security system is a good system and it deserves to be preserved as it is.
D) All of the above are normative statements.
F) C) and D)
Correct Answer

verified
Correct Answer
verified
Multiple Choice
Which of the following trade-offs does the production possibilities frontier illustrate?
A) if an economy wants to increase efficiency in production, then it must sacrifice equality in consumption
B) once an economy has reached the efficient points on its production possibilities frontier, the only way of getting more of one good is to get less of the other
C) for an economy to consume more of one good, it must stop consuming the other good entirely
D) for an economy to produce and consume goods, it must sacrifice environmental quality
F) None of the above
Correct Answer

verified
Correct Answer
verified
True/False
The circular flow model is not used anymore because it fails to perfectly replicate real world situations.
B) False
Correct Answer

verified
Correct Answer
verified
True/False
The trade-off between the production of one good and the production of another good can change over time because of technological advances.
B) False
Correct Answer

verified
Correct Answer
verified
True/False
If a line passes through the points (20,5) and (10,10), then the slope of the line is 1/2.
B) False
Correct Answer

verified
Correct Answer
verified
Multiple Choice
Figure 2-15
Relationship between Price and Cups of Coffee 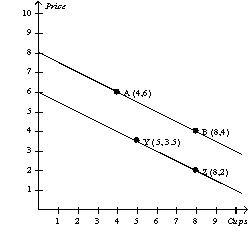 -Refer to Figure 2-15. Which of the following could result in a movement from point A to point B?
A) a change in income
B) a change in preferences
C) a change in the price of coffee
D) a change in the price of tea
F) All of the above
Correct Answer

verified
Correct Answer
verified
Multiple Choice
Figure 2-5 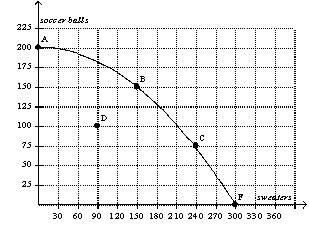 -Refer to Figure 2-5. A movement from point C to point D could be caused by
A) unemployment.
B) a decrease in society's preference for sweaters.
C) fewer resources available for production of sweaters.
D) All of the above are correct.
F) A) and C)
Correct Answer

verified
Correct Answer
verified
Multiple Choice
Figure 2-1 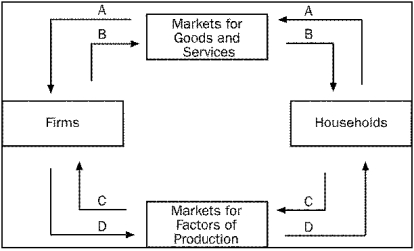 -Refer to Figure 2-1. Which arrow represents the flow of income payments?
A) A
B) B
C) C
D) D
F) A) and B)
Correct Answer

verified
Correct Answer
verified
True/False
Figure 2-14 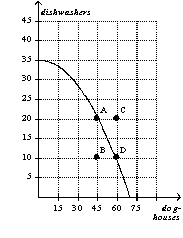 -Refer to Figure 2-14. Points B and C represent infeasible outcomes for this economy.
B) False
Correct Answer

verified
Correct Answer
verified
True/False
When a variable that is named on an axis of a graph changes, the curve shifts.
B) False
Correct Answer

verified
Correct Answer
verified
Multiple Choice
Instead of conducting laboratory experiments to generate data to test their theories, economists often
A) ask winners of the Nobel Prize in Economics to evaluate their theories.
B) argue that data is impossible to collect in economics.
C) gather data from historical episodes of economic change.
D) assume that data would support their theories.
F) None of the above
Correct Answer

verified
Correct Answer
verified
Multiple Choice
Figure 2-6 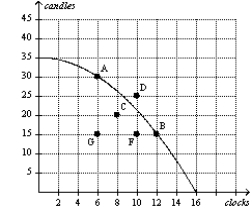 -Refer to Figure 2-6. Efficient production is represented by which point(s) ?
A) A, B
B) A, B, C, F, G
C) C, F, G
D) D
F) All of the above
Correct Answer

verified
Correct Answer
verified
Multiple Choice
Figure 2-7 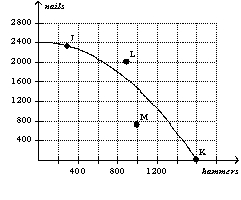 -Refer to Figure 2-7. Which point on the graph best represents the fact that, because resources are scarce, not every conceivable outcome is feasible?
A) point J
B) point K
C) point L
D) point M
F) All of the above
Correct Answer

verified
Correct Answer
verified
Showing 481 - 500 of 535
Related Exams