A) The correlation coefficient will equal 0 because it violates the assumption of normality.
B) The correlation coefficient will equal 1.0 because it violates the assumption of normality.
C) The correlation coefficient will equal 0 because it violates the assumption of linearity.
D) The correlation coefficient will equal 1.0 because it violates the assumption of linearity.
F) B) and D)
Correct Answer

verified
Correct Answer
verified
Multiple Choice
A researcher measures the correlation of the time it take participants to complete two tasks purported to measure the same cognitive skill.Participant times are converted to ranks from fastest to slowest.If = 165 and n = 20,then what is the decision for this correlation test?
A) retain the null hypothesis
B) reject the null hypothesis
C) there is not enough information to answer this question
E) A) and C)
Correct Answer

verified
Correct Answer
verified
Multiple Choice
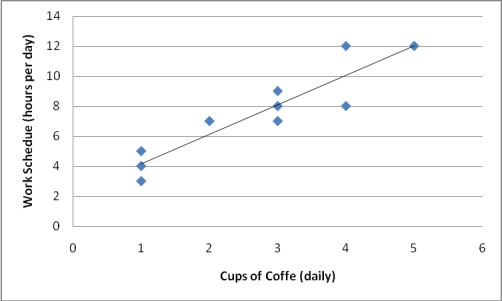
A researcher measures the following correlation between cups of coffee consumed daily and daily work schedule.Which description best explains the relationship between these two factors?

A) The more a person works, the more coffee he or she tends to drink.
B) The less a person works, the more coffee he or she tends to drink.
C) The more a person works, the less coffee he or she tends to drink.
D) No linear pattern is evident.
F) A) and C)
Correct Answer

verified
Correct Answer
verified
True/False
The Spearman correlation coefficient is used to measure the correlation between two nominal variables.
B) False
Correct Answer

verified
Correct Answer
verified
True/False
Correlation does not show causation.
B) False
Correct Answer

verified
Correct Answer
verified
Multiple Choice
A researcher measures the correlation between gender and student aptitude scores from 0 to 100 among 20 participants.If rpb = .49,then what is the decision for this correlation test?
A) retain the null hypothesis
B) reject the null hypothesis
C) there is not enough information to answer this question
E) All of the above
Correct Answer

verified
Correct Answer
verified
Multiple Choice
A researcher computes the following phi correlation coefficient: r = .42.If the sample size was 20,then what is the decision for this correlation test?
A) retain the null hypothesis
B) reject the null hypothesis
C) there is not enough information to answer this question
E) All of the above
Correct Answer

verified
Correct Answer
verified
True/False
A positive correlation is always stronger than a negative correlation.
B) False
Correct Answer

verified
Correct Answer
verified
True/False
Restriction of range occurs when an unanticipated variable not accounted for in a research study that could be causing or associated with observed changes in one or more measured variables.
B) False
Correct Answer

verified
Correct Answer
verified
True/False
Outliers can change both the direction and strength of a correlation coefficient.
B) False
Correct Answer

verified
Correct Answer
verified
Multiple Choice
The correlation coefficient ranges from -1.0 to +1.0,with values closer to ±1.0 indicating ______.
A) a less positive relationship between two factors
B) a stronger relationship between two factors
C) that two factors are less likely to be related
D) that the correlation is due to outliers
F) B) and C)
Correct Answer

verified
Correct Answer
verified
True/False
The value of the sum of products can be positive or negative.
B) False
Correct Answer

verified
Correct Answer
verified
Multiple Choice
The coefficient of determination is ______.
A) a measure of effect size
B) mathematically equivalent to 2
C) equal to the correlation coefficient squared
D) all of these
F) A) and C)
Correct Answer

verified
Correct Answer
verified
Multiple Choice
Which of the following is the assumption that the best way to describe the pattern of data is using a straight line?
A) normality
B) linearity
C) homoscedasticity
D) restriction of range
F) All of the above
Correct Answer

verified
Correct Answer
verified
True/False
The closer that data points fall to the regression line,the more closely two factors are related.
B) False
Correct Answer

verified
Correct Answer
verified
Multiple Choice
A researcher measures the following correlation between number of years of education and life satisfaction: r = +.08.What is the value of the coefficient of determination?
A) .08
B) .16
C) .01
D) .11
F) B) and D)
Correct Answer

verified
Correct Answer
verified
Multiple Choice
The correlation coefficient ranges between ______ and ______.
A) 0, +1
B) -1, 0
C) -1, +1
D) - , +
F) All of the above
Correct Answer

verified
Correct Answer
verified
True/False
When we compute many correlations in a single study,we report each correlation coefficient in a table called a correlation matrix.
B) False
Correct Answer

verified
Correct Answer
verified
Multiple Choice
The correlation coefficient is used to measure the ______ and ______ of the linear relationship between two factors.
A) date, time
B) mean, variance
C) significance, effect size
D) strength, direction
F) A) and C)
Correct Answer

verified
Correct Answer
verified
Multiple Choice
The normality assumption states that the population of X and Y scores form a bivariate ("two variable") normal distribution,such that ______.
A) the population of X and Y scores are normally distributed
B) for each X score, the distribution of Y scores is normally distributed
C) for each Y score, the distribution of X scores is normally distributed
D) all of these
F) A) and D)
Correct Answer

verified
Correct Answer
verified
Showing 21 - 40 of 80
Related Exams